Basic M-Mode Protocols
M-Mode Imaging of the Cardiac Structures
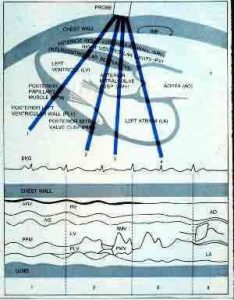
The M-mode, or motion mode, is not an image of the heart, but rather a diagram that shows how the position of cardiac structures move during the cardiac cycle. The M-mode tracings are typically performed in the parasternal views. In the parasternal long axis view, the M-mode cursor should be made through the minor axis of the aorta and left atrium, the mitral leaflet tips, and the minor axis of the left ventricle just superior to the papillary muscle. In the parasternal short axis view, M-mode may be made of the mitral anterior and posterior leaflets, and through the minor axis of the left ventricle just inferior to the mitral apparatus.
The M-mode displays time along the horizontal axis and depth along the vertical axis to depict movement of the cardiac valves and wall motion, (Figure 1).

M-mode is used to record a graphic representation of wall motion, cardiac valvular motion, posterior cardiac wall motion, or fetal heart rhythm. M-mode is essential to display subtle abnormalities of specific cardiac structures. It also allows one to make measurements of cardiac dimensions and motion patterns in relation to the ECG rhythm.
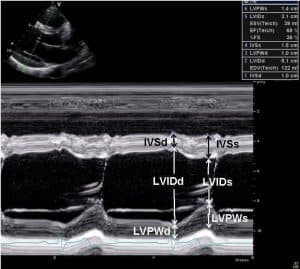
Normal values for cardiac dimensions in adults are well established. (Figure 2) lists normal M-mode measurements for cardiac structures and left ventricular ejection fraction. To obtain these measurements, the M-mode cursor may be directed in any location in that specific line of site from the transducer position to record the movement of the specific cardiac structure.
| Normal M-Mode Measurements | |
|---|---|
| Aortic Root Dimension | 1.9–4.0 cm |
| Aortic cusp separation 1.5–2.6 cm | 1.5–2.6 cm |
| Left atrial dimension | 1.9–4.0 cm |
| Mitral valve excursion | 1.6–3.0 cm |
| Left ventricular end-diastolic dimension | 3.5–5.7 cm |
| Left ventricular end-systolic dimension | 2.5–4.0 cm |
| Left ventricular ejection fraction | >55% |
| Interventricular septal thickness | 0.6–1.2 cm |
| Posterior left ventricular thickness | 0.6–1.2 cm |
| Right ventricular dimension | 0.7–2.7 cm |
Figure 2. Normal adult M-mode measurements
Mitral Valve
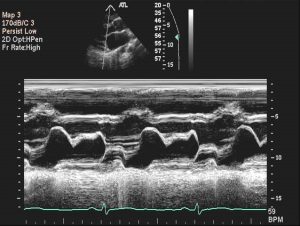
Echographically, the mitral valve is one of the easiest cardiac structures to recognize. With M-mode, the mitral valve has the greatest amplitude and excursion and can be unquestionably recognized by its “double,” or biphasic, kick. This kick is caused by the initial opening of the valve in ventricular diastole and the atrial contraction at end diastole, (Figure 3).


When diastole begins, the anterior mitral leaflet executes a rapid anterior motion, coming to a peak at point E. While the ventricle fills rapidly with blood from the left atrium, the valve drifts closed at point F. The rate at which this movement takes place represents the rate of left atrial emptying and serves as an important indicator of altered mitral function. As the left atrium contracts, the mitral valve opens in a shorter anterior excursion and terminates at point A, which occurs just after the P wave on the electrocardiogram. This motion is followed by a rapid posterior movement from point B to point C, which coincides with the QRS systolic component on the electrocardiogram produced by the left ventricular contractility closing the valve.
Subtle changes in the mitral valve may be recorded with M-mode tracings. The M-mode tracing of mitral valve prolapse in seen in (Figure 4).
The mitral leaflets are thickened and there is late systolic prolapse of both the anterior and posterior mitral leaflets below the “C-D” line (arrow).
The M-mode tracing of hypertrophic cardiomyopathy demonstrates abnormal movement of the systolic anterior motion (SAM) component of the mitral valve apparatus as seen in (Figure 5).
In addition, there is septal hypertrophy.
Mitral stenosis on M-mode will demonstrate the thickened, calcified valve with reduced amplitude and decreased prolonged E-F slope as seen in (Figure 6).
Aortic Valve and Left Atrium
The echoes recorded from the aortic root on M-mode should be parallel, moving anteriorly in systole and posteriorly in diastole. When the transducer is angled slightly medial, two of the three semilunar cusps can be visualized. The right coronary cusp is shown anterior and the noncoronary cusp posterior, (Figure 7).
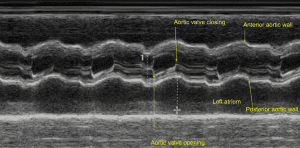

When seen, the left coronary cusp is shown in the midline between the other two cusps. The onset of systole causes the cusps to open to the full extent of the aortic root. The extreme force of blood through this opening causes a fine flutter to occur during systole. As the pressure relents in the ventricle, the cusps begin to drift to a closed position until they are fully closed in diastole.
The chamber posterior to the aortic root is the left atrium, which can be recognized by its immobile posterior wall. As one sweeps from the mitral apparatus medially and superiorly, the left ventricular wall blends into the atrioventricular groove and finally into the left atrial wall. Thus, the sweep demonstrates good contractility in the left ventricle, (with anterior wall motion in systole – to the atrioventricular area, where the posterior wall starts to move posteriorly in systole), and then to the left atrium, where there is no movement. (Figure 8)
Other structures posterior to the left atrial cavity that may lead to confusion in the identification of the left atrial wall are the left atrial appendage and descending aorta. The left atrial appendage may appear prominent posterior to the left atrial wall if there is severe enlargement of the left atrial cavity (especially seen in patients with severe mitral valve disease). The 2D evaluation with the transducer in the apical four-chamber position clarifies the atrial appendage as a separate structure. The descending aorta may also be recognized as a parallel, pulsating, tubular structure posterior to the left atrial cavity. The aorta is not continuous with the left ventricular wall, as is the left atrial wall. Thus, the cardiac sonographer should be able to distinguish this echo reflection as normal anatomy.
The aortic valve may develop calcifications which lead aortic stenosis and as a result there is reduced opening of the leaflets in systole as seen in (Figure 9A).

In obstructive hypertrophic cardiomyopathy, the systolic anterior motion causes the aortic leaflets early mid-systolic closure and seen in (Figure 9B).

Interventricular Septum
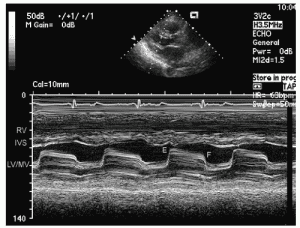
The septum thickens in systole at the mid-portion of the ventricular cavity, (Figure 10).
The measurement and evaluation of septal thickness and motion should be made at this point. The septal thickness and posterior wall thickness are measured at end-diastole at the onset of the QRS complex. Normal septal thickness should match that of the posterior left ventricular wall and not exceed 1.2 cm.
LEFT VENTRICLE
Correct identification of the left ventricle may be made when both sides of the septum are seen to contract with the posterior heart wall. If the septum is not well defined or does not appear to move well, a more medial placement of the transducer along the sternal border with a lateral angulation may permit better visualization of this structure.
The three layers of the posterior heart wall—the endocardium (inner layer), myocardium (middle layer), and epicardium (outer layer)—should be identified separately from the pericardium, (Figure 11).

Sometimes it is difficult to separate the epicardium from the pericardium until the gain is reduced. The myocardium usually has a fine scattering of echoes throughout its muscular layer. The endocardium may be a more difficult structure to record because it reflects a weak echo pattern. The chordae are much denser structures than the endocardium; generally the chordae are shown in the systolic segment along the anterior surface of the endocardium. As the ventricle contracts, the endocardial velocity is greater than the chordae tendineae velocity.
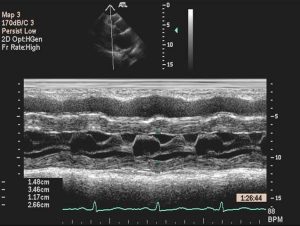
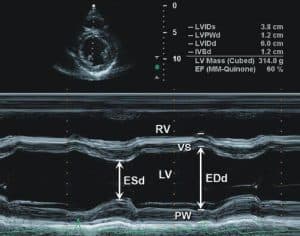
The left ventricular internal dimension (LVDd) at end-diastole (D) is measured at the onset of the QRS complex, and the systolic internal dimension (LVDs) is measured at the maximal excursion of the ventricular septum, which normally occurs before the maximal excursion of the posterior wall. These measurements correspond to the maximal and minimal internal dimensions between the ventricular septum and the posterobasal ventricular free wall endocardium. (Figure 12)
Tricuspid Valve
From the parasternal long axis view of the mitral apparatus, the beam should be angled slightly medially under the sternum to record the M-mode of the tricuspid valve. It is fairly easy to identify the whipping motion of the anterior valve in systole and early diastole, although this technique is rarely used. The appearance is very similar to that of the mitral valve apparatus.
Pulmonary Valve
The anterior aortic root forms the posterior boundary of the pulmonary valve area. The appearance of the pulmonic cusp is similar to the aortic cusp and requires very slight angulations of the beam to demonstrate fully. With two-dimensional capabilities, the optimal view is generally a high-parasternal short-axis view with a slight angulation of the beam toward the left shoulder.
At the beginning of diastole, the pulmonary valve is displaced downward and is represented anteriorly on the ultrasound recording. The low transducer position with upward beam angulation, together with the vertical inclination of the pulmonary ring, results in the examination of the valve from below. All elevations of the pulmonary valve in the stream of flow are represented as posterior movements on the echo. Likewise, downward movements are represented by anterior cusp positions on the trace, see (Figure 13).

The pulmonary valve begins to move posteriorly (points e to f) in a gradual manner as the right ventricle fills in diastole, (Figure 14).

Atrial systole elevates the valve and produces a 3- to 7-mm posterior movement a (dip). The valve completes the opening (points b and c), and, at the c to d point, the valve moves upward with ventricular systole.
Technical considerations in M-mode measurements.
• If M-mode angles are oblique, measurements should be made using 2D with 2D calipers placed along minor axis. Even if oblique, include M-mode in study for motion of structures.
• Measure: LVIDd, LVIDs : Include only one Ejection Fraction% on the report. It is more accurate to calculate EF% by biplane-MOD.
• It is okay to give EF% as range for atrial fib/flutter or frequent ectopy, but range should agree with calculated EF%.
• Visual estimation of EF% is not recommended and is only used as a last resort for technically extremely difficult cases
• Echo contrast should be utilized when 2 or more ventricular segments are not seen.
• LA: Omit LA single plain dimension from report if it does not agree with LA biplane volume.
• Ao root diameter: Aortic root measurement is performed at sinus of Valsalva.
• Ascending aorta: Asc Ao measurement is done at largest minor axis seen (not necessarily at sinotubular junction)
References
- Lang, RM, Badano LP, Mor-Avi, V, et al. Recommendations for Cardiac Chamber Quantification by Echocardiography in Adults: An Update from the American Society of Echocardiography and the European Association of Cardiovascular Imaging, JASE, January 2015
- Mitchell, C, Rahko PS, Blauwet, LA, et al. Guidelines for Performing a Comprehensive Transthoracic Echocardiographic Examination in Adults: Recommendations from the American Society of Echocardiography. JASE 32:1, January 2019.
- Hagen-Ansert, SL. Textbook of Diagnostic Sonography, 8th Edition, Elsevier, St. Louis, 2017.
- Oh, JK, Seward JB, Tajik, AJ. The Echo Manual, Wolters Kluwer, Lippincott Williams & Wilkins, 2006.
- Otto C: Textbook of clinical echocardiography, ed 4, Philadelphia, 2009, Saunders.