PART 3: Basic Spectral Doppler and Color Flow Protocols
Doppler Applications and Technique
Doppler echocardiography is established as a valuable noninvasive tool in clinical cardiology to provide hemodynamic information about the function of the cardiac valves and chambers of the heart. When combined with conventional 2D echo, Doppler techniques may be focused to provide specific information on the velocity flow patterns of a particular area within the heart. The ability to provide qualitative and quantitative information in evaluating valvular function, intracardiac shunts, dysfunction of a native or prosthetic valve, or the obstruction of a surgically inserted shunt has contributed to the clinical care of the cardiac patient. Understanding of cardiac physiology and hemodynamics is critical to the interpretation of the Doppler information. In addition, the sonographer must clearly understand Doppler principles, artifacts, and pitfalls in order to produce a quality study.
Doppler Effect. The Doppler effect is the apparent change in frequency of sound or light waves emitted by a source as it moves away from or toward an observer, Figure 1.

Sound that reflects off a moving object undergoes a change in frequency. Objects moving toward the transducer reflect sound at a higher frequency than that of the incident pulse, and objects moving away reflect sound at a lower frequency. The difference between the transmitted and the received frequency is called the Doppler frequency shift. This Doppler effect is applied when the motion of laminar or turbulent flow is detected within a vascular structure.
In the medical application of the Doppler principle, the frequency of the reflected sound wave is the same as the frequency transmitted only if the reflector is stationary. If the red blood cell (RBC) moves along the line of the ultrasound beam (parallel to flow), the Doppler shift is directly proportional to the velocity of the RBC. If the RBC moves away from the transducer in the plane of the beam, the fall in frequency is directly proportional to the velocity and direction of RBC movement. The frequency of the echo will be higher than the transmitted frequency if the reflector is moving toward the transducer, and lower if the reflector is moving away,
Doppler Shift. The difference between the receiving echo frequency and the frequency of the transmitted beam is called the Doppler shift. This change in the frequency of a reflected wave is caused by relative motion between the reflector and the transducer’s beam. Generally the Doppler shift is only a small fraction of the transmitted ultrasound frequency.
The Doppler shift frequency is proportional to the velocity of the moving reflector or blood cell. The frequency at which a transducer transmits ultrasound influences the frequency of the Doppler shift. The higher the original, or transmitted, frequency, the greater is the shift in frequency for a given reflector velocity. The returning frequency increases if the RBC is moving toward the transducer and decreases if the blood cell is moving away from the transducer. The Doppler effect produces a shift that is the reflected frequency minus the transmitted frequency. When interrogating the same blood vessel with transducers of different frequencies, the higher-frequency transducer will generate a larger Doppler shift frequency.
Doppler Angle. The angle that the reflector path makes with the ultrasound beam is called the Doppler angle. As the Doppler angle increases from 0 to 90 degrees, the detected Doppler frequency shift decreases, Figure 2.
At 90 degrees, the Doppler shift is zero, regardless of flow velocity. The frequency of the Doppler shift is proportional to the cosine of the Doppler angle. The beam should be parallel to flow to obtain the maximum velocity. The closer the Doppler angle is to zero, the more accurate is the flow velocity. If the angle of the beam to the reflector exceeds 60 degrees, velocities will no longer be accurate.
Spectral Analysis. Blood flow through a vessel may be laminar or turbulent, Figure 3.

Laminar flow is the normal pattern of vessel flow, which occurs at different velocities, as flow in the center of the vessel is faster than it is at the edges. When the range of velocities increases significantly, the flow pattern becomes turbulent. The audio of the Doppler signal enables the sonographer to distinguish laminar flow from turbulent flow patterns. The process of spectral analysis allows the instrumentation to break down the complex multifrequency Doppler signal into individual frequency components.
The spectral display shows the distribution of Doppler frequencies versus time. This is displayed as velocity on the vertical axis and time on the horizontal axis, Figure 4.
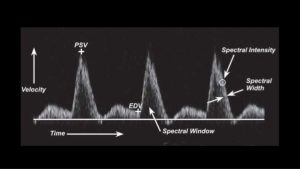
Flow toward the transducer is displayed above the baseline, and flow away from the transducer is displayed below the baseline. In normal arterial flow, the spectral window is clear, the spectral width is not increased, and the spectral intensity is not bright.
When the area of the vessel that is examined contains RBCs moving at similar velocities, the cells will be represented on the spectral display by a narrow band. This area under the band is called the “window.” As flow becomes more turbulent or disturbed, the velocity increases, producing spectral broadening on the display. A very stenotic (high-flow velocity) lesion would cause the window to become completely filled in, with increased spectral width and intensity.
The Doppler and Color flow Doppler Examination. The Doppler color flow mapping (CFM) examination is generally performed along with the conventional 2D examination. The advantage of CFM is its ability to rapidly investigate flow direction and movement within the cardiac chambers. The sonographer should acquire the respective cine loop(s) for 2D and color flow Doppler and acquire the representative still frames for M-modes and PW/CW Doppler.
| DOPPLER AND COLOR DOPPLER WINDOWS |
| Apical Window Mitral valve, tricuspid valve, left ventricular outflow tract, aortic valve, pulmonary vein inflow, superior vena cava inflow, interventricular septum, interatrial septum |
| Parasternal Short-Axis Window Pulmonary valve, main pulmonary artery, right and left branches pulmonary artery (patent ductus arteriosus flow), tricuspid valve |
| Suprasternal Notch Window Ascending aorta, descending aorta, patent ductus arteriosus flow, right pulmonary artery |
| Subcostal Window Interatrial septum, interventricular septum, inferior vena cava flow, superior vena cava flow |
| Parasternal Long-Axis Window Mitral regurgitation, tricuspid regurgitation, aortic regurgitation |
| Right Parasternal Window Ascending aorta |
Color Flow Doppler
Color flow Doppler is sensitive to Doppler signals throughout an adjustable portion of the area of interest. A real-time image is displayed with both gray scale and color flow in the vascular structures. Color flow Doppler is able to analyze the phase information, frequency, and amplitude of returning echoes.
Velocities are quantified by allocating a pixel to flow toward the transducer and flow away from the transducer. Each velocity frequency change is allocated a color. Color maps may be adjusted to obtain different color assignments for the velocity levels; signals from moving red blood cells are assigned a color (red or blue) based on the direction of the phase shift (i.e., the direction of blood flow toward or away from the transducer). Flow toward the transducer is recorded in red, and flow away from the transducer is blue, (see Figure 5).

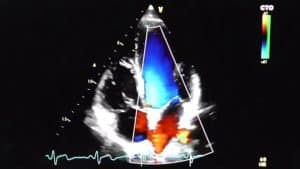
This is denoted on the color bar on the right upper side of the image. As the velocities increase, the flow pattern in the variance mode turns from red to various shades of red, orange, and yellow before it aliases. Likewise flow away from the transducer is recorded in blue; this color turns to various shades of blue, turquoise, and green before it aliases. Depending on the location of the transducer, the flow signals from various structures within the heart appear as different colors. An understanding of cardiac hemodynamics helps the examiner understand the flow patterns.
Aliasing occurs in color flow imaging when Doppler frequencies exceed the Nyquist limit, just as in spectral Doppler. This appears as a wrap-around of the displayed color. The velocity scale, (pulse repetition frequency), may be adjusted to avoid aliasing. Color arising from sources other than moving blood is referred to as flash artifact or ghosting.
Cardiac Color Flow Examination
The color Doppler sector should be long, spanning the entire cardiac image from top to bottom. This sector should be narrow enough to obtain the ideal frame rate, (FR) ≥17 Hz. Although normal cardiac flows are difficult to accurately time during the color flow mode (CFM) examination because of its slow frame rate, the use of color M-mode (with a faster frame rate) allows one to precisely determine specific cardiac events in correlation with the ECG. The color M-mode is made in the same manner as a conventional M-mode study, Figure 6.

The cursor is placed through the area of interest, and the flow is evaluated using an autocorrelation technique.
| Normal Color Flow Mapping Examination and Techniques |
|---|
| The color flow mapping examination is generally performed in the same planes used for conventional Doppler |
| ● Parasternal long-axis view: MV, TV, AO |
| ● Parasternal short-axis view: AO, PA, RVOT, IAS, TV ● Parasternal short-axis view: MV, TV, AO, PV |
| ● Apical four-chamber plane: MV, TV ● Apical five-chamber plane: LVOT, AV |
| ● Apical long-axis, two-chamber view: LV, MV, LA |
| ● Subcostal four-chamber view: IAS, IVS, RV, LV, RA, LA ● Subcostal view: IVC, hepatic veins ● Subcostal 5 chamber view: AO, LVOT ● Subcostal short-axis view: AO, PA, RVOT |
| ● Suprasternal view (long axis): ascending and descending aorta, SVC ● Suprasternal view (short axis): arch, RPA, LA, SVC, pulmonary veins |
| AO, Aorta; AV, aortic valve; IAS, interatrial septum; LA, left atrium; LV, left ventricle; RA, right atrium; RV, right ventricle; IVS, interventricular septum; LA, left atrium; LV, left ventricle; LVOT, left ventricular outflow tract; MV, mitral valve; PA, pulmonary artery; PV, pulmonary valve; RA, right atrium; RPA, right pulmonary artery; RV, right ventricle; RVOT, right ventricular outflow tract; SVC, superior vena cava; TV, tricuspid valve. |
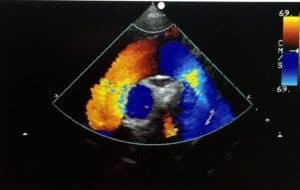
Parasternal Long-Axis View for Color Flow Mapping. In diastole, the parasternal long-axis view shows the left atrium filled with various shades of red as the pulmonary venous flow enters the atrial cavity from the right and left branches, Figure 7.
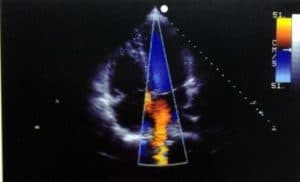
.While the blood is pushed toward the mitral leaflets, some turbulence is shown when the flow enters into the left ventricle.
During ventricular systole, the mitral leaflets close and the ventricle contracts to push the blood through the left ventricular outflow tract through the open aortic cusps. The blood is now flowing towards the transducer and is shown as a shade of red with some yellow highlights as it approaches the aortic root. No color flow is seen to cross at the level of the membranous septum in the normal patient.
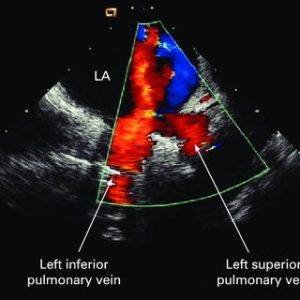
Right Parasternal View for Color Flow Mapping. The right parasternal view is performed after the patient has been rolled into a steep right decubitus position. The transducer is placed along the right sternal border in the second intercostal space. This view may be useful for visualization of the entrance of the superior vena cava into the right atrium. The caval flow appears red as it enters the right atrium. This view also provides another window to image the entrance of the pulmonary veins into the left atrium. Flow patterns from the veins may be seen, whereas the actual veins are difficult to image on the two-dimensional study. (Figure 8)
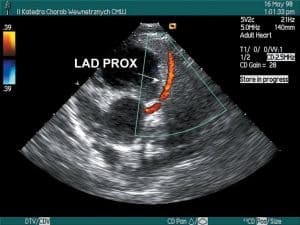
Parasternal Short-Axis View for Color Flow Mapping. At the level of the aortic valve, the blood flow appears as a red signal moving toward the transducer from the right atrium into the right ventricle through the open tricuspid valve in diastole. Flow into the coronary arteries is sometimes seen in the right coronary, left main coronary, and circumflex and proximal left anterior descending arteries. Depending on the orientation of the coronary arteries, the blood flow appears yellow-red or bluish, Figure 9.
 |
 |
| A | B |
| Figure 9. Color Doppler of the left anterior descending and right coronary artery. | |
With slight angulation of the transducer, flow from the inferior vena cava can be seen while it flows into the right atrium. This flow appears red. When atrial systole occurs, blue signals can be seen moving from the right atrium into the inferior vena cava. Blue signals can also be seen as blood leaves the right ventricular outflow tract to enter the pulmonary valve and main pulmonary artery in systole. While the transducer is angled slightly, the flow from the main pulmonary artery is seen to move into the bifurcation of the right and left pulmonary arteries. This flow is still primarily blue while it moves away from the transducer.
A short-axis view at the level of the mitral valve in diastole may show flow signals in the mitral orifice and the right ventricle. When the transducer is angled medially, the right ventricular inflow plane may show flow signals while they arise from the coronary sinus into the right heart during diastole.
Apical View for Color Flow Mapping. The apical four-chamber view is one of the most useful views in color flow mapping. In the typical four-chamber view, the operator can follow blood flow as it enters the atrial cavities and flows through the atrioventricular valves in diastole to enter the ventricular chambers before it exits through the great arteries.
The right-side events appear slightly earlier as the tricuspid valve opens before the mitral valve. When blood fills the atrial cavities, it appears red as it flows toward the transducer, (see Figure 10). Pulmonary venous inflow to the left atrial cavity may be seen in this four-chamber view. Flow from the right and left upper veins appears reddish with some yellow (see Figure 8), whereas flow from the lower left pulmonary vein appears blue as it moves away from the transducer. Although the transducer is angled more posterior and medial, inflow from the superior vena cava is red when it enters the medial aspect of the right atrium along the border of the interatrial septum. (see Figure 10)
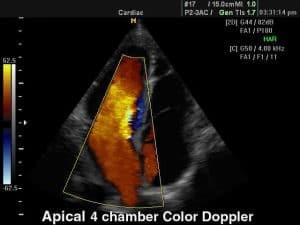
Diastolic flow through the atrioventricular orifice occurs at a slightly higher velocity, giving rise to changes in colors from red to yellow. The flow returns to red as the inflow chamber of the ventricles fills. When the flow reaches the apex, it begins to swirl toward the ventricular outflow tract and the color changes to blue. Again the velocity increases as the flow moves toward the leaflets of the aorta in systole, changing the color into more intense blue shades. Flow in the ascending aorta should be a uniform blue, Regurgitant flow into the left atrium from the incompetent mitral or tricuspid valve will appear as a blue-green mixed pattern.
Subcostal View for Color Flow Mapping. The subcostal long-axis view shows the inferior vena cava inflow pattern as it enters the right atrial cavity, Figure 11.
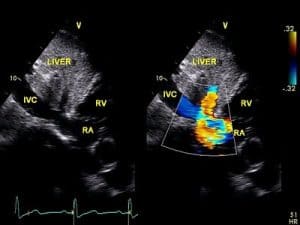
The flow from the hepatic veins appears blue when blood enters the inferior vena cava at the level of the diaphragm throughout diastole and systole. During atrial systole, some retrograde flow is seen as it moves from the right atrium into the inferior vena cava and hepatic veins. With the transducer angled slightly to the left, pulsatile flow signals through the descending and abdominal aorta may be seen in systole.
In the subcostal short-axis view, the right ventricular outflow tract and pulmonary artery may be demonstrated. The right ventricular outflow tract appears blue as it leaves the right ventricle to enter through the pulmonary cusps. The velocity increases slightly, causing some color change from blue to turquoise and green before returning to blue when it enters the main pulmonary artery. Some aliasing may be experienced as the flow bounces off the tricuspid leaflets and right ventricular walls. Red and yellow flow can be seen arising from the coronary artery along the posterior wall of the right ventricle. Superior vena cava inflow appears as red and orange flow as it enters the right atrium.
Suprasternal View for Color Flow Mapping. In the suprasternal long-axis plane of the ascending aorta, arch, and descending aorta, flow signals begin as red in the ascending aorta and turn to blue when flow moves into the arch (some aliasing and reversal of color is seen along this point as the flow bounces off the walls in the arch). When the flow enters the descending aorta, a bright blue color is seen, Figure 12.
The atrial and ventricular septa are well seen on this view, and adequate visualization of a possible defect may be made in this imaging plane.
In the short-axis plane, the superior vena cava flow is blue when it enters the right atrium. Flow within the aortic arch and right pulmonary artery is also seen. In some patients, pulmonary venous inflow may be seen in the suprasternal view.
Normal Cardiac Spectral Doppler Flow Patterns
It is important to understand the relationship between the 2D echo and the Doppler flow velocity study. The 2D echo allows assessment of cardiac anatomy and function; Doppler velocity flow analysis allows examination of blood flow rather than cardiac anatomy.
The Doppler signals should be obtained with the sample volume parallel to the direction of flow. Recall the flow of blood occurs in three-dimensional space, whereas the real-time image is only in two dimensions. Therefore, the two-dimensional image serves as a guide to the operator as small adjustments of the transducer and sample volume are made in the valve orifice to record the optimal Doppler signals. The key is to produce a spectral signal to show a well-defined velocity envelope along with a clearly defined audio tone. The clarity of the audio tone cannot be emphasized enough. Frequently the clarity of tone is used to guide the Doppler cursor into the correct plane to record the maximum velocity.
Blood flow toward the transducer is displayed by a time velocity waveform above the baseline at point zero, or a positive deflection (Figure 13).

Flow away from the Doppler signal is displayed below the baseline or as a negative deflection. A simultaneous ECG should be displayed to help time the cardiac cycle.
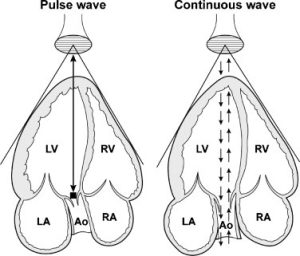
Spectral Doppler. Two basic modes of spectral Doppler are utilized in echocardiography, namely continuous wave and pulsed wave, (see Figure 14)
 |
 |
| A | B |
| Figure 14. Pulsed Wave Doppler uses one crystal that pulses to transmit the signal while also receiving the returning signal while continuous wave Doppler continuously sends and receives a signal. | |
Pulsed Wave Doppler
Pulsed wave (PW) Doppler is used for lower velocity flow and has one crystal that pulses to transmit the signal while also listening or receiving the returning signal. The PW Doppler uses brief bursts of sound like those used in echo imaging. These bursts are usually of a longer duration and produce well-defined frequencies. The sonographer may set the gate, or Doppler window, to a specific area of interest in the vascular structure so interrogated. This means that a specific area of interest may be examined at the point the gate or sample volume is placed. For example, in a longitudinal view of the aorta, the sample volume may be placed directly in the middle of the aortic flow, and recordings only from that particular area “within the gate or window” will be measured.
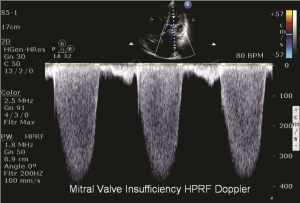
With pulsed Doppler, for accurate detection of Doppler frequencies to occur, the Doppler signal must be sampled at least twice for each cycle in the wave. This phenomenon is known as the Nyquist limit. When the Nyquist limit is exceeded, an artifact called aliasing occurs. Aliasing presents on the spectral display as an apparent reversal of flow direction and a “wrapping around” of the Doppler spectral waveform, Figure 15.

The highest velocity, therefore, may not be accurately demonstrated when aliasing occurs; this usually happens when the flows are greater than 2 m/sec. One can avoid aliasing by changing the Doppler signal from pulsed wave to continuous wave to record the higher velocities accurately.
The pulsed wave transducer is constructed with a single crystal that sends bursts of ultrasound at a rate called the pulsed repetition frequency. The transducer receives sound waves backscattered from moving red blood cells during a limited time between transmitted pulses. A time gating device is then used to select the precise depth from which the returning signal has originated because the signals return from the heart at different times.
Continuous Wave Doppler
The continuous wave probe differs from the pulsed wave probe in that it is able to both send and receive sound (see Figure 14). One crystal continuously emits sound; the other receives sound as it is backscattered to the transducer. This probe may be part of a phased or annular array imaging probe or may be a stand-alone independent probe. If it is part of a two-dimensional imaging transducer, the sample direction may be steered by use of the trackball.
Continuous wave Doppler is used to record the higher velocity flow patterns, usually above 2 m/sec, and is especially useful in echocardiography. Unlike pulsed wave Doppler, CW Doppler cannot pinpoint exactly where along the beam axis flow is occurring, as it samples all of the flow along its path. In the example of a five-chamber view of the heart, a sample volume placed in the left ventricular outflow tract will sample all the flow along that “line” to include the flows in the outflow tract and in the ascending aorta.
The Pedof continuous wave (non-imaging) probe is smaller pencil-like probe and thus has advantages in obtaining a good Doppler study, (see Figure 16).

This small diameter allows greater flexibility to angle between small rib interspaces or obtain signals from the suprasternal notch or right parasternal border. The audio portion of the Doppler examination becomes a critical factor in this study because there is not 2D image available to guide the transducer location.
Often both 2D-CW and Pedof probes are used within the echocardiographic study. Once the proper transducer position is found with the imaging transducer, the angulation and window are marked for proper placement of the Pedof probe. The audio sound and spectral wave pattern are then used to guide the correction angulation of the beam for maximum-velocity recordings. Because there is not a particular sample volume site within the continuous wave beam velocities are recorded from several points along the linear beam. This technique has the ability to record maximum velocities without alias patterns and is especially useful for very high-velocity patterns as seen in regurgitant lesions or stenotic valves.
Audio Signals and Spectral Display of Doppler Signals
The best Doppler signals are obtained when the ultrasound beam is parallel or nearly parallel to the flow of blood. Therefore, the best windows used to record the 2D images may not be the best windows to record Doppler flow patterns. This section discusses the technique for recording quality Doppler signals from the inflow and outflow tracts through the cardiac valves.
Audio Signals. The signal from the arterial flow is very different from that of the venous flow; likewise, mitral and tricuspid patterns differ from the aortic and pulmonary valve patterns. The blood flow velocity determines the pitch or frequency of the audio signal. As the velocity becomes higher, the pitch becomes higher; as the velocity decreases, so does the pitch.
Normal blood flow across the cardiac valves demonstrates a narrow range of velocity with a smooth and even Doppler audio signal. When the flow becomes turbulent or disturbed, as occurs distal to an obstruction or regurgitation of the valve, the tone becomes harsh. The high-velocity flows produce a very-high-frequency signal with a sharp whistling-hissing tone. This signal may be found in obstruction, shunts, and regurgitant lesions.
Other movements within the cardiac chambers produce audio signals, but these signals are not as well defined. The valve opening and closure can be heard as a discrete click when the Doppler window is located too close to the valve. The normal cardiac function causes the valve to move in and out of the Doppler beam, producing a lower-frequency signal. Therefore, careful angulation along with the audio signal helps the sonographer observe the dynamics of the cardiac cycle for correct beam placement to obtain the best quality Doppler signal.
Spectral Analysis. The spectral analysis waveform allows the sonographer to store a graphic display of what the audio signal is recording because it provides a representation of blood flow velocities over time. The velocity on the vertical axis is measured in centimeters per second or meters per second, whereas time is shown on the horizontal axis, see Figure 2. Therefore, the direction and velocity of flow may be measured very accurately when the beam is parallel to the flow.
A normal spectral display pattern has a typical appearance. In normal blood flow, the cells generally have a uniform direction with similar velocities. The spectral tracing appears as a smooth mitral velocity pattern bordered by a narrow band of velocities. As the velocity increases, so does the turbulence within the border of the narrow-band velocities, producing a filling of the velocity curve. As the cardiac structure moves in and out of the beam, the Doppler frequency shift is recorded as tall artifact spikes.
Doppler Quantitation
Quantitation of the Doppler signal to obtain hemodynamic information is derived from the measurement of blood flow velocity, therefore it is critical that the angle of the Doppler signal be as parallel to flow as possible. The Doppler equation is based on the principle that the velocity of blood flow is directly proportional to the Doppler frequency shift and the speed of sound in tissue, and it is inversely related to twice the frequency of transmitted ultrasound and the cosine of the angle of incidence between the ultrasound beam and the direction of blood flow. Therefore, the relationship between the angle and its cosine becomes significant and can be a source of error if ignored. If the angle is less than 20 degrees, the cosine is close to 1 and can be ignored. If the angle increases beyond 20 degrees, the cosine becomes less than 1 and may produce an underestimation of velocity.
Doppler Examination
The Doppler examination is performed along with the 2D study of the cardiac structures. During this conventional study, the sonographer notes structures that may need special attention during the Doppler examination (e.g., a redundant mitral valve leaflet may indicate the need to search for mitral regurgitation). Throughout the Doppler study, various patient positions and transducer rotations are necessary to place the sample volume parallel to blood flow. There are basically five transducer positions used to record quality Doppler flow patterns: the apical four chamber, the left parasternal, subcostal, suprasternal, and the right parasternal. The patient should be forewarned about the audio sounds produced by the Doppler signal because some find the sound alarming if the volume is set too high.
| Technical considerations to obtain quality Spectral Doppler |
|---|
| • Every effort should be made to avoid measuring post-ectopic beats. Average 3 to 10 consecutive beats if frequent ectopy (i.e., bigeminy) or atrial fib/flutter is present. • Every effort should be made to align Doppler parallel to flow. • Doppler should be recorded at 100 mm/s sweep speed except for when needing to average consecutive beats or when documenting for respiratory variations. • Acquire spectral signal at end-expiration or during quiet breathing. • All signals should be set with minimal “wall filter” to show signal intersecting with baseline to allow for more accurate time measurements. • PW Doppler should be recorded with gains/reject set to show clear envelope. • Sample volume size should be between 2 and 5 mm. |
| 1. PW Doppler transmitral flow recording with sample volume at the leaflet; tips during opening; sample volume beyond leaflet tips and into LV makes signal less crisp; MV sample volume at annulus for regurgitant fraction calculations and to better see A kick for A duration measurement 2. PW DTI is recorded from lateral and septal mitral annulus; septal velocity should be slightly smaller; use clinical eye if big discrepancy exists 3. PW Doppler of pulmonary veins with sample volume >1 cm in the pulm vein for cleanest signal; signal should be free of MR jet signal and truly reflect pulm vein S, D, and AR flow 4. CW Doppler between MV and LVOT for IVRT; avoid AI and MR signals (PW may be necessary) 5. PW Doppler of MV with Valsalva as needed for differentiation between stage 3 and 4 diastolic dysfunction and stage 2 from normal 6. PW Doppler of LVOT about 0.5 to 1.0 cm below AoV; if LVOT obstruction present, show pre- and post-obstruction Doppler signals 7. CW Doppler through AoV |
The following protocol is a minimum standard to be performed for all complete 2D/M-mode, color flow Doppler, and spectral Doppler exams. Additional views are often required and are based on presence of disease and clinical indications. Digitally acquire the following views in the order listed below.
Parasternal Views
Left Parasternal Window for Doppler. The parasternal long-axis view with the patient rolled in a left lateral decubitus position has limited applications with Doppler. The transducer is more perpendicular to the cardiac structures than parallel, so the maximum velocity is difficult to record. However, disturbances in flow, especially mitral, aortic, and tricuspid (with the transducer angled medial) regurgitation, may be recorded in some patients with this view. Thickened cusps may direct the regurgitant flow in a pathway not typically seen as well on the apical view as on the parasternal long-axis view. A ventricular septal defect may be visualized on this view because the flow of blood is more parallel to the beam. Both muscular and membranous defects may be imaged from this view along with the apical and subcostal views.
Right Parasternal Window for Doppler. The right parasternal position is most useful in the difficult-to-image adult or older pediatric patient after surgery who has a jet of aortic stenosis directed more to the right. The patient is rolled into a steep right decubitus position and the transducer placed in the first, second, or third intercostal space to the right of the sternum. Often the Pedof probe is easier to position in this patient, with the audible sound as the guide to the maximal velocity jet.
Parasternal Short-Axis Window for Doppler. The parasternal short-axis view is very useful for recording flow from the right ventricular outflow tract and pulmonary artery. The sample volume should be placed distal to the pulmonary cusps to record flow in the main pulmonary artery. The flow pattern is similar to that obtained from the aortic flow when the transducer is placed in the apical position but with a slightly slower upstroke, Figure 17.

The spectral display shows a velocity curve below the baseline with a narrow band of frequencies. Normal pulmonary flow velocities range from 60 to 90 cm/sec in adults and 70 to 110 cm/sec in children. This view is useful for recording pulmonary regurgitation and stenosis, as well as abnormal patent ductus arteriosus flow that may be present in the neonate or child.
As the sample volume is positioned closer to the bifurcation of the pulmonary artery, the flow velocity increases slightly. To record velocities in the right ventricular outflow tract, the sample volume is placed just proximal to the pulmonary valve. The flow pattern is similar to the pulmonary outflow but has a slightly lower velocity. This view is especially useful for detecting a left-to-right shunt at the membranous ventricular septum, a coronary artery fistula, or a muscle bundle in the right ventricular outflow tract.
Apical Window for Doppler. The apical four-chamber position is one of the most widely used for recording multiple Doppler patterns. The patient lies in the left lateral decubitus position with the transducer placed at the apical impulse and directed toward the patient’s right shoulder. This position allows sampling of flow through the mitral, tricuspid, and aortic valves at nearly parallel angles to the beam.
Inflow through the mitral valve leaflets may be recorded by placing the Doppler signal at the level of the tips of the leaflets. The pulsed sample volume may be moved from the tips of the leaflets to the level of the mitral annulus to obtain a clean recording. The normal mitral flow velocity tracing is similar to that found on an M-mode recording, (see Figure 18).
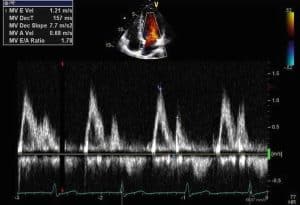
The initial peak occurs during the rapid-filling phase of diastole. The smaller second peak occurs late in diastole (with atrial contraction). In patients with decreased left ventricular compliance, the first peak may be lower and the second peak higher. Normal flow velocity across the mitral valve ranges from 60 to 130 cm/sec in adults and similar velocities in children.
The tricuspid valve flow may be recorded in the apical position while the transducer is angled slightly to the right. With the transducer position at the level of the leaflets, a pattern similar to mitral valve flow is recorded with two peaks during diastole. The first occurs during ventricular filling and the second with the onset of atrial contraction, Figure 19.

The velocity pattern is much lower in the tricuspid valve, with significant respiratory changes that increase during inspiration and decrease during expiration. The normal velocity range is 30 to 70 cm/sec for adults and is similar for children.
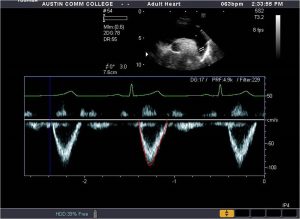
In the apical position, the transducer may be angled slightly anterior or rotated into a long-axis view to record blood flow from the left ventricular outflow tract as it enters the aortic root and ascending aorta. With the pulsed-wave sample volume placed just proximal to the aortic root (in the left ventricular outflow tract), the flow is away from the transducer during systole. The spectral display shows a narrow band of frequencies below the baseline, Figure 20.

The normal velocity pattern in the left ventricular outflow tract in the adult is 70 to 110 cm/sec, and it is similar in children. As the sample volume is moved across the aortic valve, flow can be recorded within the ascending aorta. This velocity pattern is slightly higher and peaks earlier. Normal velocities range from 100 to 170 cm/sec in adults and 120 to 180 cm/sec in children.
| Maximal Velocities Recorded with Doppler in Normal Individuals | ||
|---|---|---|
| Children (cm/sec) |
Adults (cm/sec) |
|
| Mitral flow | 80-130 | 60-130 |
| Tricuspid flow | 50-80 | 30-70 |
| Pulmonary artery | 70-110 | 60-90 |
| Left ventricle | 70-120 | 70-110 |
| Aorta | 120-180 | 100-170 |
Subcostal Window for Doppler. The subcostal four chamber view is especially useful in the neonatal and pediatric population because the transducer is placed in the subcostal region and, with gentle pressure applied, the transducer is angled superiorly to record the four chambers of the heart. In adults with pulmonary obstructive disease, this view is useful because the increased size of the lungs pushes the heart into the view of the transducer without too much pressure on the diaphragm.
In this position the interatrial and interventricular septa are perpendicular to the transducer, so the presence of a left-to-right defect shows positive high-velocity flow from the baseline on the spectral display and the flow is parallel to the beam. A right-to-left flow shows as a negative deflection on the spectral display. This view may also be useful for recording the flow pattern from the pulmonary veins (upper right and left and lower left) when they enter the left atrium.
The superior vena cava flow is shown as a high-pitched, low-velocity, positive deflection from the baseline on the spectral display. The inferior vena cava flow may be recorded as a negative display on the spectral display, Figure 21.

A better view of the inferior vena cava flow is made in the subcostal long-axis view through the right lobe of the liver. The inferior vena cava may be well seen as it moves slightly anterior to pierce the diaphragm before it enters the right atrial cavity. This display would project as a low-velocity positive reflection from the baseline.
Suprasternal Window for Doppler. The suprasternal position is used to record velocities in the ascending and descending aorta, right pulmonary artery, superior vena cava inflow, and pulmonary venous return into the left atrium. Initially the patient’s shoulders are elevated by a pillow, the neck extended, and the transducer placed in the suprasternal notch with an inferior angulation of the beam.
The transducer sample volume is placed in the ascending aorta when the walls of the aorta are as nearly perpendicular to the beam as possible. The flow is then parallel to the pulsed Doppler cursor, and a positive deflection with a narrow band of frequencies is shown above the baseline. Careful sweeping back and forth allows the operator to determine the highest velocity possible. The audio sound helps direct the probe to the maximal jet flow. If high velocities are suspected, the continuous wave probe is used.
The spectral tracing from this probe contains a wider range of frequencies with the same peak velocity measurements as the pulsed wave. As the transducer is angled to the left and posterior, velocity from the descending aorta is recorded, Figure 22.
Generally with the pulsed Doppler, the sample volume is placed near the level of the left subclavian artery to record the maximum flow away from the transducer as it flows down the descending aorta to the abdominal aorta.
The flow pattern of the superior vena cava may be recorded from the suprasternal position as the transducer is directed inferiorly and to the right (medial) of the ascending aorta. Flow away from the transducer is recorded with two low-velocity peaks in systole and diastole, which may increase in height during inspiration. This view is useful for recording flow patterns that may be obstructed in the area of the superior vena cava.
The demonstration of the pulmonary veins from the suprasternal notch is more difficult to obtain. With the transducer aligned with the ascending aorta, the beam is angled more posterior to record the dorsal aspect of the left atrial cavity. The right and left upper pulmonary veins appear as a negative flow away from the baseline, whereas the right and left lower veins appear as a positive flow from the baseline. The velocity is low, with changes in respiration and cardiac motion.
References
- Quinones MA, Otto CM, Stoddard M, et al. Recommendations for Quantification of Doppler Echocardiography: A Report from the Doppler Quantification Task Force of the Nomenclature and Standards Committee of the American Society of Echocardiography, JASE 15:2, February 2002
- Hagen-Ansert, SL, Textbook of Diagnostic Sonography, 8th Edition, Elsevier, St. Louis, 2017.
- Mitchell C, Rahko PS, Blauwet LA, et al. Guidelines for Performing a Comprehensive Transthoracic Echocardiographic Examination in Adults: Recommendations from the American Society of Echocardiography, JASE 32:1, January 2019.
- Oh, JK, Seward JB, Tajik, AJ. The Echo Manual, Wolters Kluwer, Lippincott Williams & Wilkins, 2006.
- Otto C: Textbook of clinical echocardiography, ed 4, Philadelphia, 2009, Saunders.